Elasticsearch Logstash and Kibana popularly abbreviated as ELK is a modern data aggregation, data querying and data visualization tool. All the compnents of the ELK stack are seamlessly integrated for working coherently. ELK stack is fast gaining popularity and is being adopted by corporate conglomerates too. It has a simple setting up process and even simpler learning curve. I will introduce in brief the three components of ELK stack.
To make the process of using ELK stack even clearer I would be visualizing the Sacramento Real estate transaction data
Logstash
I am logtstash before elasticsearch, going against the convention, because here first main processing takes place through logstash conf file. The data (SacramentoRealEstateTransaction.csv) file is loaded into elasticsearch, via a simple logstash script. The script was as follows:
`
    input {
      file {
        path => "C:/Users/deolal/Desktop/Sacramentorealestatetransactions.csv"
        sincedb_path => ["C:/Users/deolal/logstash-5.2.0/sincedb/sdbfile"]
        start_position => "beginning"
      }
    }
    filter {
      csv {
          separator => ","
         columns => ["street","city","zip","state","beds","bath","square_feet","type","sale_date","price","latitude","longitude"]
      }
      mutate {
          convert => [ "price", "float" ]
      }
    }
    output {
       elasticsearch {
         document_type => "estate-cost"
         hosts => ["http://localhost:9200"]
         index => "sacramento"
      }
    }
        `
Note here we use the logtstash CSV filter to parse the csv file. And mutate filter is used to change the datatype of a particular field. The data is loaded to an index name sacramento and is displayed in the Kibana dashboard.
Elasticsearch
Elasticsearch is a schema free search engine, based on Lucene. It provides various REST APIs to query across data. It is fast because it queries data based on Index. It is like searching the contents of book through its index. Data in index is organized on basis of documents.An index can contain multiple documents. Elasticsearch centrally stores our data. An example of its REST API is the GET API that searches across multiple or unique indexes. It can executed through the console/command line via CURL or one can use POSTMAN.
CURL syntax is as follows for a simple GET query:
curl -XGET 'localhost:9200/sacramento/?pretty'
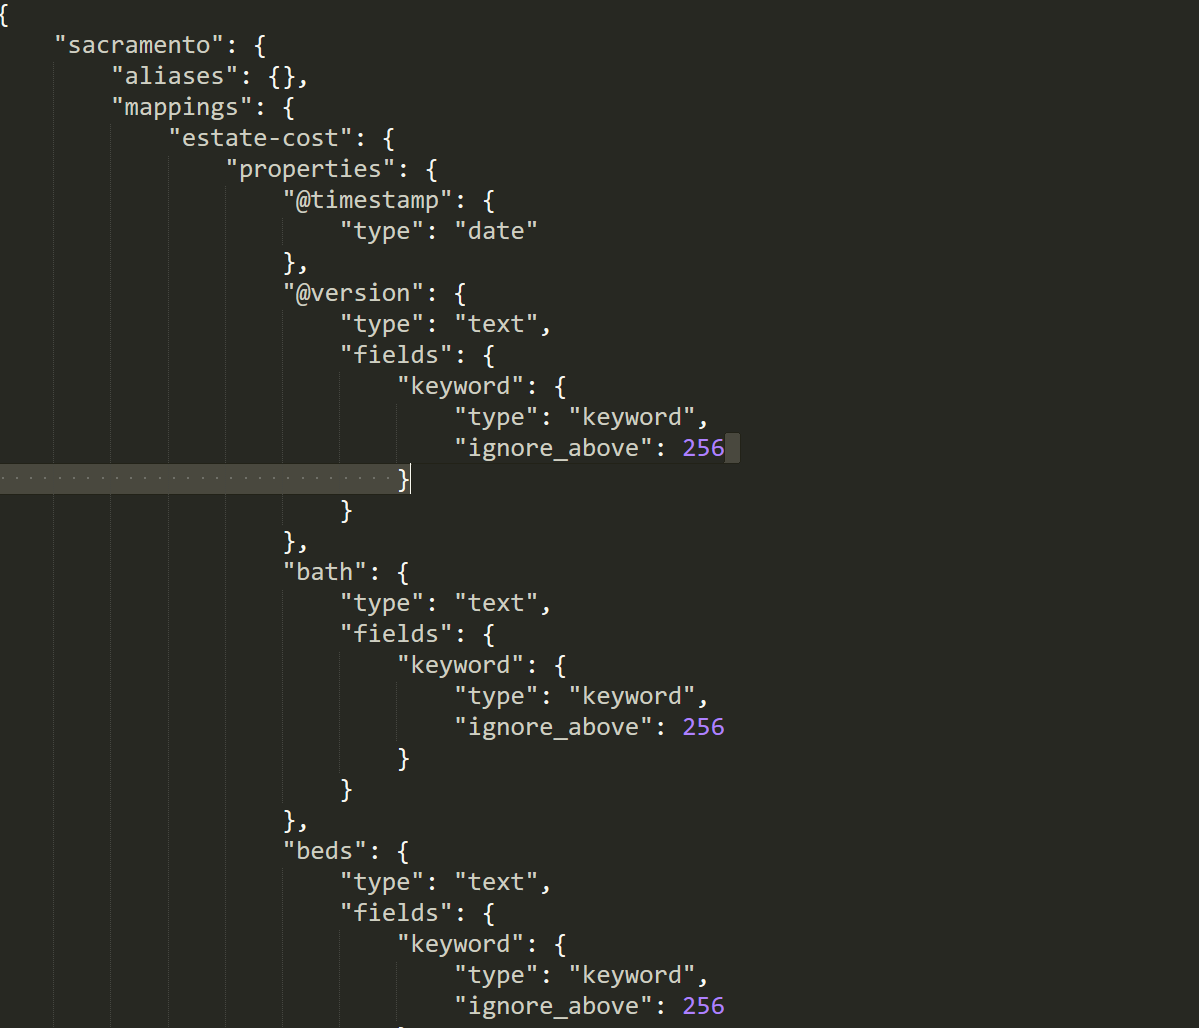
It returns a json document for the index sacramento giving all the details of the contained fields in the data. The response pattern was as follows:
Kibana
Kibana is the frontend of ELK stack. Kibana lets us visualize our Elasticsearch data. It ships in with classic histograms,pie charts and data tables. Then there are data aggregation queries which either can be written using an aptly name language called painless or it can also be controlled using the Kibana GUI. Other than that Kibana has options for mapping GEO points on the map and also lets us plot timeseries data.
An instance of painless syntax could be a simple GET query:
GET /_search
    {
        "query": {
            "simple_query_string" : {
                "fields" : ["city"],
                "query" : "Rio"
            }
        }
    }
This matches all the city with Rio in them and returns the details associated with them.
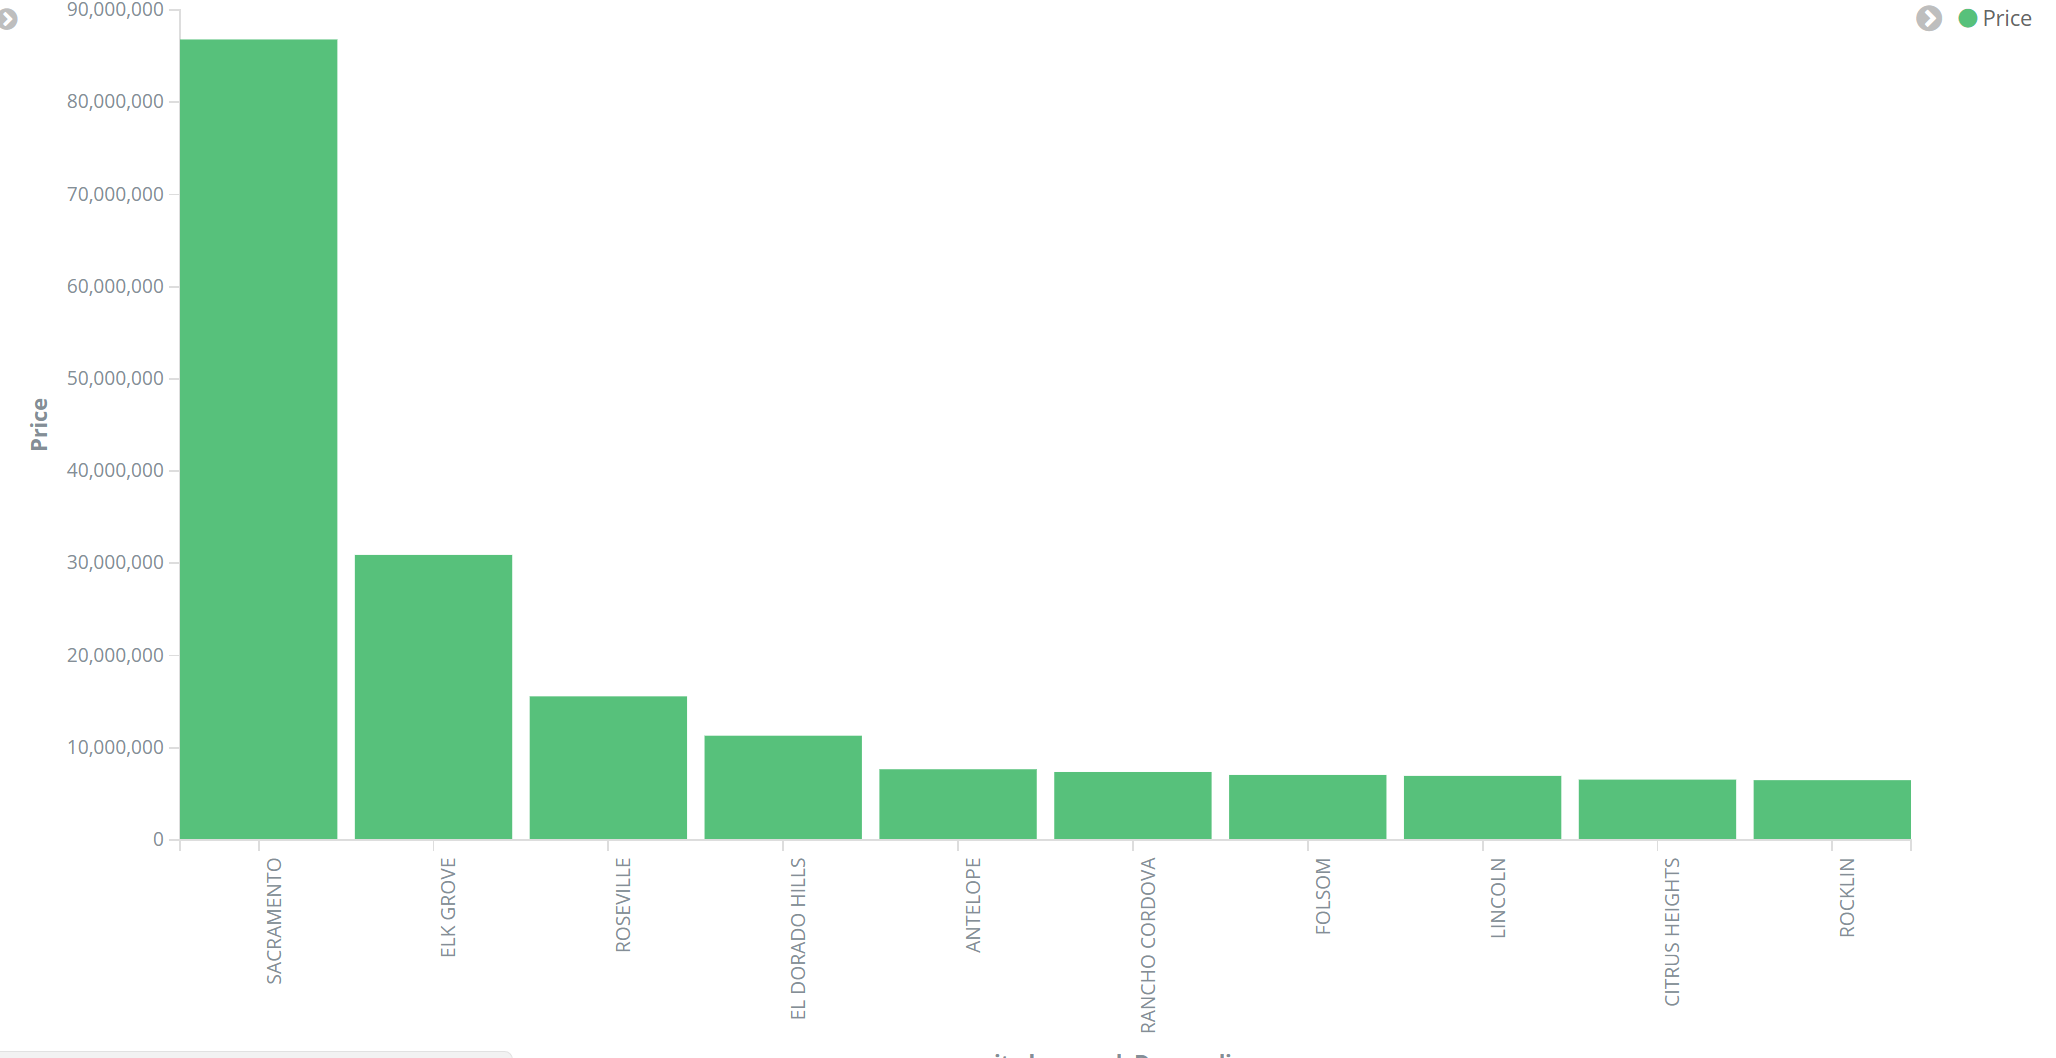
Here is another example in which I have created a Kibana bar chart that gives us comparison of prices incurred in real estate transactions per city.